1) Which of the following statements is/are incorrect?
Yes, the answer is correct. Score: 1
Accepted Answers:
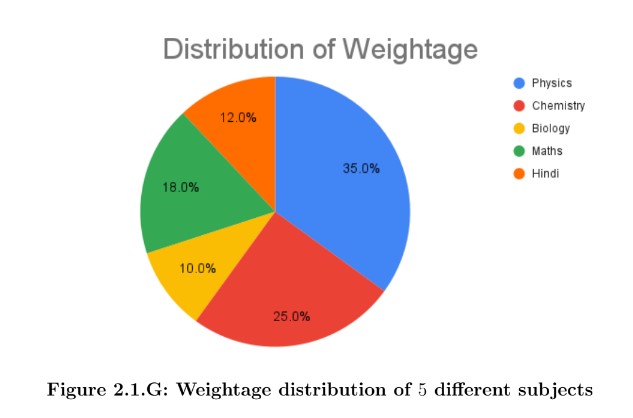
Figure 2.1.G shows the pie chart representation of the weightage distribution of 5 different subjects in an exam. Based on this information, answer questions (2) and (3).
2) If the exam is for a total of 500 marks, then what is the aggregate distribution of marks in Physics, Maths and Biology?
Yes, the answer is correct. Score: 1
Accepted Answers:
(Type: Numeric) 315
1 point
1 point
3) Choose the correct statement(s):
Yes, the answer is correct. Score: 1
Accepted Answers:
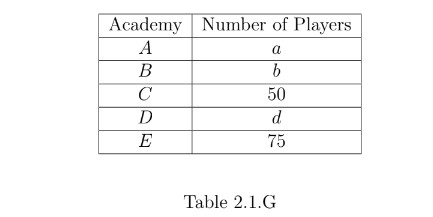
Table 2.1.G represents the distribution of 200 cricket players trained by different cricket academies in Chennai.
If each academy has trained at least one player, then based on the given information, answer questions (4), (5), (6) and (7).
4) What is the combined relative frequency of the academy A,B and D? (Enter the answer correct to 3 decimal places)
Yes, the answer is correct. Score: 1
Accepted Answers:
(Type: Range) 0.370,0.380
1 point
1 point
5) Median of the given data is:
Yes, the answer is correct. Score: 1
Accepted Answers:
1 point
6) Mode of the given data is:
Yes, the answer is correct. Score: 1
Accepted Answers:
1 point
7) Which of the following graphical representations is appropriate for the number of players in each academy for the given data in Table 2.1.G?
Yes, the answer is correct. Score: 1
Accepted Answers:
1 point
8) The data of number of students sharing the same rank is collected. Which of the following is/are suitable to represent the collected data?
Yes, the answer is correct. Score: 1
Accepted Answers:
1 point
9) Choose the correct statement about categorical data:
Yes, the answer is correct. Score: 1
Accepted Answers:
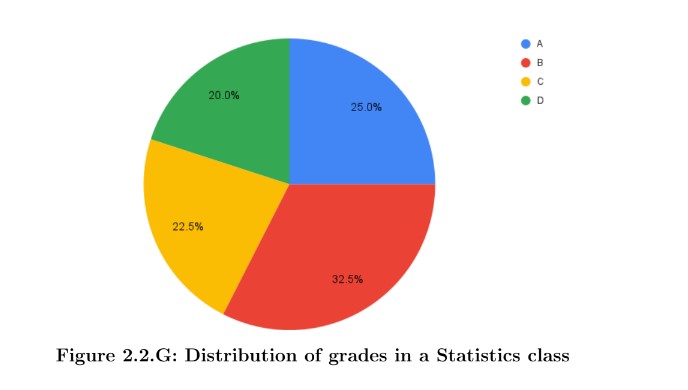
The distribution of grades in a Statistics class consisting of 80 students is shown by a pie chart in Figure 2.2.G. Based on the information given, answer the questions (10) and (11)
10) How many students have secured B grade?
Yes, the answer is correct. Score: 1
Accepted Answers:
(Type: Numeric) 26
1 point
11) What is the ratio of the students who secured a C grade to the students who secured an A grade?